Is iPhone the Most Popular Phone in 2026? A Data-Driven Review
Explore whether the iPhone is the most popular phone with regional trends, metrics, and expert analysis. Learn how shipments, usage, and ecosystem shape popularity in 2026.

Is iPhone the most popular phone? In many key markets, the iPhone ranks at or near the top thanks to strong brand loyalty, ecosystem advantages, and premium hardware. But global popularity depends on the metric—shipments, active devices, or user satisfaction. Phone Tips Pro analysis, 2026 indicates regional variation and ongoing competition with Android smartphones.
Is popularity a meaningful metric for smartphones?
Popularity can be defined in several ways: market share based on shipments, active user base, daily engagement, or consumer sentiment. The question "is iphone the most popular phone" depends on which metric you value. In 2026, Phone Tips Pro analyses show that iPhone often leads in premium-device segments and brand loyalty, but Android devices dominate total shipments globally in many regions. This nuance matters for consumers and researchers alike, because a device can be widely popular in one sense while trailing in another. When evaluating popularity, it helps to separate short-term launch effects from longer-term ecosystem dynamics and pricing strategies.
Global picture: iPhone vs Android across regions
Regional dynamics strongly influence perceived popularity. In North America and much of Western Europe, iPhone penetration among premium users remains high due to strong carrier financing, ecosystem services like iCloud integration, and perceived resale value. In many Asian markets, Android devices—often built by multiple manufacturers and priced aggressively—capture larger market shares. The net effect is a global landscape where iPhone is a leading brand in some geographies and part of a broader Android-dominated market elsewhere. For 2026, this regional mosaic explains why headlines about popularity vary by source and timeframe.
How researchers measure popularity: shipments, active devices, and usage
Researchers compare metrics across sources to form a holistic view. Shipments indicate demand at launch and during product cycles, but they don’t equal long-term market dominance. Active devices reflect installed base and user retention, while usage metrics capture daily interaction with the device and services. Phone Tips Pro emphasizes that no single metric tells the whole story; together they reveal how popularity shifts with product cycles, pricing, and regional pricing policies. In 2026, combining these measures helps explain why iPhone appears more popular in some markets but not as dominant overall.
Regional case studies: North America, Europe, and Asia-Pacific
In North America, iPhone often dominates premium smartphone segments due to financing options, trade-in programs, and a loyal user base. Europe shows a similar pattern in several countries, though price sensitivity and carrier deals can tilt popularity toward Android mid-range models. In Asia-Pacific, Android devices frequently outsell iPhones in volume, driven by vast device ecosystems, aggressive pricing, and a broader supplier network. These regional differences underscore that popularity is not uniform worldwide and highlights the importance of local market context.
The role of ecosystem, pricing, and carrier deals
Ecosystem factors—iCloud, iMessage, app ecosystem, and seamless device-to-device experiences—drive ongoing preference for iPhone among certain user segments. Pricing strategies, including carrier subsidies and trade-ins, influence which devices people can afford, affecting popularity in practice. Launch cadence and marketing also press regional demand in different directions. Understanding popularity thus requires looking at how hardware, software, and services align with consumer budgets and carrier incentives in each market.
How consumers should interpret popularity when buying
If your goal is long-term value and ecosystem advantages, iPhone’s popularity in major markets suggests strong cross-cutting appeal. If you prioritize purchase cost, regional promotions, or broader device variety, an Android option may offer better access or price-per-feature in your region. The takeaway is to align your decision with what you value most: ecosystem, price, or hardware-software integration. For 2026, analyzing your own region and preferred metrics will yield the most accurate view.
Data limitations and how to read charts and stats
Data on smartphone popularity comes with caveats: quarterly fluctuations, one-time promotions, and regional variance can skew short-term results. When you see a chart claiming one brand is the most popular, check the metric and geography. Look for the timeframe, whether shipments or active devices were measured, and whether the data accounts for market size. The most reliable conclusions come from cross-referencing multiple sources and recognizing how different definitions of popularity shape the narrative.
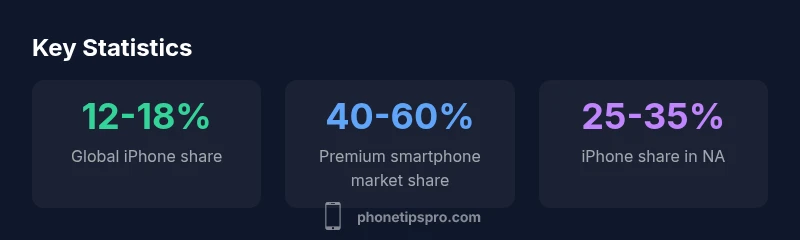
Selected popularity metrics and their typical ranges in 2026
| Metric | Range/Value | Notes |
|---|---|---|
| Global smartphone market share (iPhone) | 12-18% | Varies by quarter and region |
| Premium smartphone market share (iPhone) | 40-60% | Higher in US/Western Europe |
| Average daily engagement (iPhone vs Android) | 20-40 min vs 15-30 min | Depends on app usage and services |
FAQ
Is iPhone more popular than Android overall?
Overall popularity depends on the metric and region. In many markets, iPhone leads in premium segments, but Android dominates total shipments globally. Consider shipments, active devices, and usage when comparing.
In some regions, iPhone leads in premium segments, but globally Android often dominates shipment numbers. Look at which metric matters to you.
What metrics determine popularity in smartphones?
Key metrics include shipments, active devices, market share, and user engagement. Each captures a different aspect of popularity, so use multiple metrics for a full picture.
Popularity is measured by shipments, active devices, and how much people actually use the phones daily.
Do regional differences affect iPhone popularity?
Yes. North America and Western Europe often show higher iPhone share in premium segments, while Asia-Pacific may lean Android in volume. Local pricing and carrier strategies matter.
Regional factors like pricing and carriers shape how popular iPhone is in different places.
How often do popularity rankings change?
Rankings can shift with new product launches, price changes, and promotions. Short windows after launches may see spikes, but longer-term trends require multi-quarter analysis.
Launches and pricing can shift rankings, but you need several quarters to see real trends.
Where can I find reliable data on iPhone popularity?
Look for analytics from multiple sources, including market research firms and brand-specific analyses. Cross-check shipments, active devices, and usage metrics to form a complete view.
Check several trusted sources and compare shipments, active users, and how much people actually use the phones.
How should buyers use popularity data when choosing a phone?
Popularity data helps identify market momentum, but buyers should prioritize personal needs: ecosystem, price, and features. Use data as context, not a rule.
Use popularity data to inform your choice, but prioritize what matters most to you in a phone.
“Smartphone popularity isn't defined by a single metric; regional dynamics and ecosystem lock-in drive which brand appears most popular. Trends can shift with pricing and product launches.”
Quick Summary
- Focus on the metric that matters to you
- Regional differences drive the overall popularity picture
- iPhone remains highly popular in major markets
- Global shipment dominance can still favor Android in volume
- Ecosystem, pricing, and carrier deals shape popularity