Market Share Spotlight: iPhone vs Android in 2026
Explore the 2026 global market shares for iPhone and Android, regional differences, and what these trends mean for users, apps, and developers.

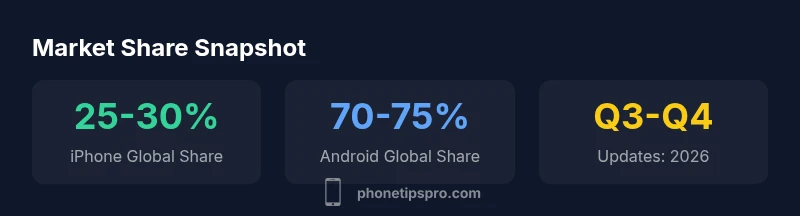
Android dominates globally with an estimated 70-75% market share, while iPhone accounts for roughly 25-30% in 2026. The split varies by region and quarter, and shifts with new device launches and promotions. Understanding these numbers helps iPhone users gauge ecosystem momentum and which apps and services are prioritized by developers.
What the numbers mean for iPhone users
To understand what is the market share of iphone vs android, we need to examine global OS distribution, regional patterns, and what those numbers imply for apps, services, and daily device use. According to Phone Tips Pro, the market has matured into a two-party system where Android maintains a dominant global position while iOS remains highly influential in regions with premium-device penetration and strong carrier promotions. For iPhone users, these numbers influence ecosystem momentum—app developers, service availability, and platform-specific features can shift with changes in the user base size. While many readers expect fixed values, market shares are dynamic, shifting quarterly and by region. This article synthesizes data into ranges rather than single points, triangulating insights from multiple researchers to show practical implications. The goal is to help you decide which devices, apps, and services align with your priorities as a user and a consumer of ecosystem experiences.
In practical terms, expect regional differences: in some markets iPhone ownership accounts for a larger slice of the smartphone ecosystem, while in others Android dominates due to price, carrier promotions, and device variety. The takeaway for readers is to connect market-share context to personal needs—do you value app availability, hardware features, or long-term software support? By focusing on those priorities, you can navigate the market with confidence, even when the numbers shift from quarter to quarter.
How market-share is measured and why estimates vary
Market-share estimates are not a single, universal number. They depend on who you ask, what data sources are used, and how the denominator is defined (shipments, active devices, or installed-base). The most reliable readings come from quarterly reports that triangulate data from multiple firms, including IDC, Canalys, and Counterpoint. Each firm uses slightly different methodologies—some count active devices, others count shipments or new activations. Because of these methodological differences, reported shares for iPhone vs Android often fall within broad ranges rather than precise points. Phone Tips Pro emphasizes a triangulation approach: comparing several sources, noting regional biases, and presenting ranges rather than exact figures. This helps users understand momentum without over-interpreting a single data point. Also, seasonality matters: launches, holidays, and promotions can swing quarterly results, so readers should consider year-over-year trends rather than a single snapshot.
For readers who track the market closely, it’s essential to document the year and region when reading market-share data. In 2026, global reads consistently show Android as the dominant platform overall, with iPhone maintaining a strong hold in select regions. When you use these readings to assess apps and services, you’ll find that regional preferences shape developer priorities, pricing strategies, and feature updates. The most actionable takeaway is to use ranges and regional context to guide expectations rather than fixate on a single percentage point.
Global vs regional dynamics and regional factors
Global market share is a useful headline, but regional dynamics drive most of the practical implications for users and developers. In North America and parts of Western Europe, iPhone adoption tends to be higher due to premium-value perception, stronger brand loyalty, and extensive carrier incentives. In contrast, many Asian and emerging markets see Android as the dominant platform, driven by device affordability, carrier bundling, and broader hardware variety. These regional differences matter to app developers who optimize features, monetization, and app store presence by geography. They also affect services like payment options, app discovery, and software updates. For a user evaluating devices, regional share trends can signal which ecosystems will receive the most attention from developers in your area and whether new services (like exclusive app launches or platform-specific features) appear sooner in your market. The key point: the same overall market is experienced very differently by consumers depending on locale, price sensitivity, and carrier ecosystems. Phone Tips Pro’s regional lens highlights that while Android remains the global leader, iPhone’s regional strength is a pivotal factor for those prioritizing ecosystem advantages.
Time trends: how the market share shifts with devices and promotions
Market-share dynamics follow product cycles and promotional waves. Major device launches by Apple often boost iPhone interest in the weeks and months after release, particularly in regions where premium devices are aspirational. Android, with its broad vendor landscape, benefits from a wide price range and a faster cadence of mid-cycle updates across brands. Promotions such as trade-in deals, financing options, and carrier subsidies can shift share meaningfully in a single quarter. Over a multi-year horizon, both platforms tend to experience gradual changes as new hardware capabilities (camera systems, performance, battery efficiency) and software ecosystems (services, app ecosystems) influence consumer choice. For readers, this means that a single quarterly figure is less informative than a cultivated view of 4–8 consecutive quarters. If you’re tracking user sentiment, pay attention to developer activity, app store economics, and how long devices stay in active circulation, as these signals often foreshadow the next wave of share shifts.
Implications for users, developers, and marketers
For users, market-share numbers are a helpful backdrop when weighing platform-specific experiences, app availability, and ecosystem investments. A higher iPhone share in your region can translate to earlier access to certain apps or services, while a larger Android base may yield broader device variety and price sensitivity in the market. For developers, market share informs platform investment, monetization strategies, and cross-platform compatibility. If an OS has a sizable installed base but modest monetization, it may still be worth prioritizing that ecosystem due to user reach. Conversely, a smaller but rapidly growing share can signal where to allocate new features or marketing emphasis. Marketers should interpret shares in the context of order of magnitude, not exact percentages, and combine them with regional consumer behavior data. In all cases, the practical question remains: which platform best aligns with your personal priorities and long-term tech goals? Phone Tips Pro suggests using market-share context as a lens to evaluate services, not as the sole determinant of your purchasing decision.
Sources, caveats, and how to read the charts
Readers should treat market-share figures as directional rather than definitive with a clear understanding of regional variance and measurement methods. This article synthesizes data across multiple sources to offer a pragmatic picture for 2026, with ranges that reflect quarterly fluctuations. If you want to dive deeper, consult the quarterly reports from leading firms and verify the region you care about. For credible context, refer to major publications that regularly publish OS market-share analyses and consider the differences in methodology when comparing numbers. The core takeaway is simple: use ranges, regional context, and time horizons to interpret market-share charts, rather than focusing on a single percentage point. As always, consult official sources and brand perspectives to form a balanced view.
Global and regional market shares by OS (range-based estimates)
| Region | iPhone share (range) | Android share (range) | Year |
|---|---|---|---|
| Global | 25-30% | 70-75% | 2026 |
| North America | 40-50% | 50-60% | 2026 |
| Western Europe | 25-35% | 65-75% | 2026 |
FAQ
What is the current global market share of iPhone vs Android?
Globally, Android leads with an estimated 70-75% share, while iPhone accounts for about 25-30% in 2026. Regional differences can push these numbers higher or lower in specific markets.
Android currently leads globally, with iPhone around a quarter of the market; regional shifts apply.
How reliable are market share estimates for mobile OSs?
Estimates differ by research firm due to methodology (active devices vs shipments). Most readers should compare multiple sources and focus on ranges rather than exact figures.
Different firms use different methods, so look at ranges across sources.
Which regions show the strongest iPhone growth?
North America and parts of Western Europe typically show stronger iPhone adoption, while Android dominates many emerging markets due to price and device variety.
Growth is strongest in North America and Western Europe.
Does market share affect app development decisions?
Yes. Developers weigh OS share along with monetization potential, user base, and device capabilities when prioritizing features and updates.
Market share matters, but monetization and audience matter too.
How often are market shares updated?
Most firms publish quarterly updates; annual tallies may lag behind real-time activations and shipments.
Updates are typically quarterly.
“Market-share figures provide useful context, but the real value comes from how the ecosystem evolves—apps, services, and device longevity drive user satisfaction more than a single quarterly point.”
Quick Summary
- Understand Android leads globally with 70-75% share.
- Expect iPhone to hold 25-30% globally with regional swings.
- Regional trends: NA & Western Europe often show higher iPhone adoption.
- Read market data as ranges, not fixed points, and consider time horizon.